
Every published number about Google Play seems to come from somewhere else, and they rarely agree. This page is the one place we keep ours. Testers Community has built and maintained its Google Play listing database since 2024. This report analyzes 3,037,501 distinct listings across its current study corpus. Each finding links to its underlying study and defined base.
Google Play in 2026, in one paragraph
Our study analyzed 3,037,501 Google Play listings. About 2,100 new ones arrive every day. Almost all are free, one in ten is a game, and only 12.2% show a star rating. The typical app has between 100 and 499 lifetime installs, and 28.3% have not been updated in over a year. A million publisher accounts stand behind the store, but 3.3% of them hold 42.8% of the listings.

How many apps are on Google Play?
We observed 3,037,501 distinct listings from 27 July to 25 August 2026. Google publishes no official app total or complete public directory. Because the observation spans a month, our figure is a research corpus, not the number of apps live on one day.
Published estimates run from about 1.58 million to 3.5 million and use different dates and methods. Cleanup waves change availability, every counter reaches a different set of apps, and "an app" is defined differently by each. The full account of why the counts disagree, and how to cite any of them honestly, is in how many apps are on Google Play.
How many apps launch each day?
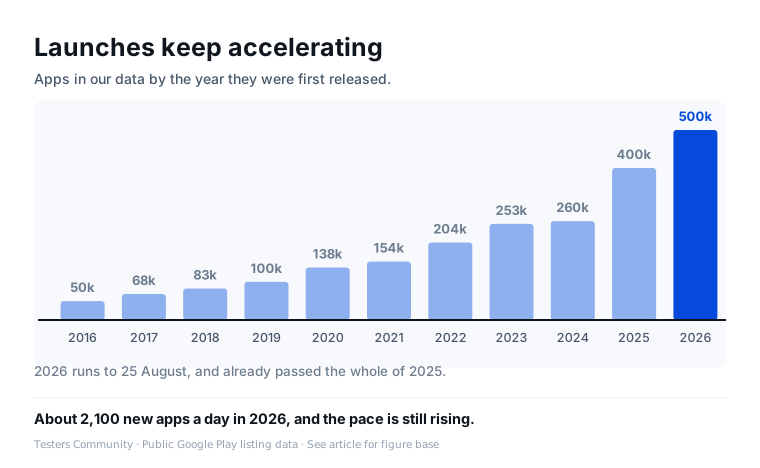
About 2,100 a day in 2026. Of the listings in our data that show a release date, 499,548 were first released in 2026, and our data runs to 25 August. That pace passed the whole of 2025, which produced 399,738, with four months of the year still to go.
A separate discovery batch contained 250,952 app IDs previously unseen by our database. Of those, 179,614 produced listing records; collection failed for 71,338. Discovery is not a launch count, and collection failure is not evidence of removal. See the discovery-batch analysis for the method and results.
How many are games?
312,795 listings sit in a game category, 10.3% of our study. Games behave differently from everything else: they are far more likely to pass a million installs, far more likely to carry ads, and more than twice as common in the collected discovery batch as in the full study corpus: 21.1% versus 10.3%.
Free, paid, ads and in-app purchases
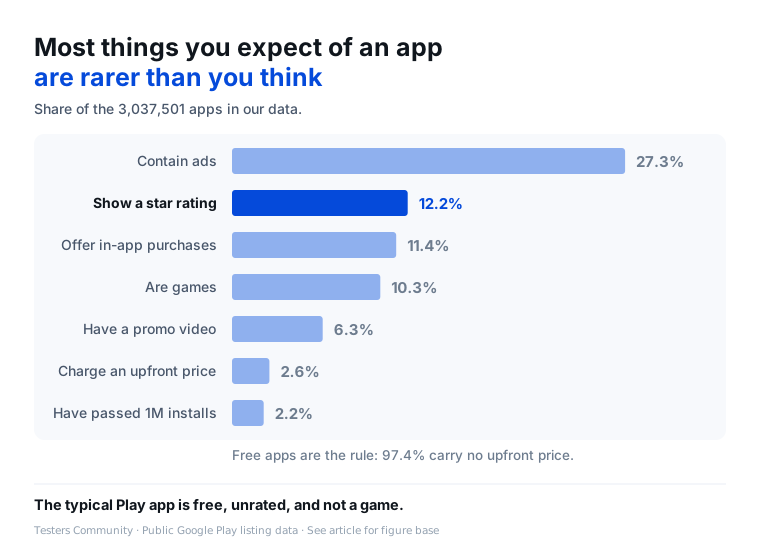
97.4% of listings are free to install. The 2.56% that charge an upfront price typically ask $1.99, and nine in ten of them stay under $9.99. Money comes in through the free apps instead: 27.3% declare ads and 11.4% offer in-app purchases.
How many apps show a rating?
12.2%. Google Play displays a star score only once an app has gathered enough ratings, and 878 of every 1,000 listings have not. Among apps first released in 2026, 96.4% show no rating at all. Where a score is shown, the average is 4.04, which says more about who leaves ratings than about the apps.
The share rises steeply with reach: 0.1% of apps under 100 installs show a rating, and 93.6% of apps past a million do. A silent listing is the normal state of a new app, not a fault in it.
How many installs does a typical app get?
Between 100 and 499 lifetime installs. That is the middle of the store. 36.4% of listings have never passed 100 installs and 62.7% have never passed 1,000. At the other end, 2.2% have passed one million, roughly one app in 45.
Averages mislead here, because a few thousand giant apps pull them up by orders of magnitude. The typical app is the honest figure, and it is small.
How many apps are abandoned?
28.3% of listings have not shipped an update in over a year, and 8.1% have been silent for more than three. Just over half, 53.5%, were updated within the last six months. These shares are computed over the 3,036,563 listings that show an update date.
Abandonment is not evenly spread. Apps with more installs update more often, and the oldest launch classes carry the largest share of silent listings. The shelf a new app joins is therefore thinner than the raw count suggests, and more cluttered.
Who publishes Google Play apps?
1,034,014 distinct publisher IDs appear across the listings in our study. Most observed accounts hold one app, while 3.3% hold at least ten and account for 42.8% of the study's listings. The largest observed account holds 10,985 apps.
The numbers in one table
Every headline figure on this page, with the base it is computed over and the study it comes from. Studies not yet linked are being published over the coming weeks.
| Measure | Value | Base | Full study |
|---|---|---|---|
| Distinct listings observed | 3,037,501 | 27 July to 25 August 2026 | We Analyzed 3 Million Google Play Listings in 2026 |
| New apps per day, 2026 | about 2,100 | 499,548 dated 2026 releases to 25 August | About 2,100 Apps Launch on Google Play Each Day |
| Previously unseen IDs in one discovery batch | 250,952 | batch dated 23 August 2026 | Google Play App Discovery: One Weekly Batch in 2026 |
| IDs without a collected listing record | 71,338 (28.4%) | 250,952 discovered IDs | Google Play App Discovery: One Weekly Batch in 2026 |
| Released in 2026 so far | 499,548 | 2,311,689 with a release date | About 2,100 Apps Launch on Google Play Each Day |
| Released in 2025 | 399,738 | 2,311,689 with a release date | About 2,100 Apps Launch on Google Play Each Day |
| Listings with no release date shown | 23.9% | 3,037,501 listings | Half of Dated Google Play Listings Were Released Since 2024 |
| Games | 312,795 (10.3%) | 3,037,501 listings | Games Are 5× as Likely to Show 1M+ Installs |
| Largest category, Education | 337,128 listings | 3,037,501 listings | Education Is Google Play’s Most Crowded Category |
| Education apps never past 1,000 installs | 63.4% | 337,128 Education listings | Google Play’s Largest Category Is Also One of Its Quietest |
| Fastest-growing category, Puzzle | 39.9% launched in 2026 | dated Puzzle listings | Puzzle Leads Google Play’s 2026 Influx of New Listings |
| Hardest category by difficulty score, Arcade | 52.6 of 60 | 40 categories scored | Google Play Listing-Pressure Index by Category (2026) |
| Most permissions requested, Health & Fitness | 14 typical | 40 categories | Health & Fitness Apps Declare the Most Android Permissions |
| Free | 97.4% | 3,037,501 listings | Only 2.56% of Google Play Apps Charge Up Front |
| Charge an upfront price | 2.56% | 3,037,501 listings | Only 2.56% of Google Play Apps Charge Up Front |
| Typical upfront price | $1.99 (9 in 10 under $9.99) | paid listings | Only 2.56% of Google Play Apps Charge Up Front |
| Contain ads | 27.3% | 3,037,501 listings | Only 2.56% of Google Play Apps Charge Up Front |
| Offer in-app purchases | 11.4% | 3,037,501 listings | Most Google Play IAP Apps Use Price Ladders, Not One Price |
| Show a star rating | 12.2% | 3,037,501 listings | Why Most Google Play Apps Remain Below 1,000 Installs |
| Average score, rated apps only | 4.04 | 370,363 rated listings | Nearly 9 in 10 Google Play Apps Show No Rating |
| 2026 releases with no rating | 96.4% | 499,548 dated 2026 releases | Nearly 9 in 10 Google Play Apps Show No Rating |
| Typical lifetime installs | 100 to 499 | 3,037,501 listings | Most Google Play Apps Never Reach 1,000 Installs |
| Under 100 lifetime installs | 36.4% | 3,037,501 listings | Most Google Play Apps Never Reach 1,000 Installs |
| Under 1,000 lifetime installs | 62.7% | 3,037,501 listings | Most Google Play Apps Never Reach 1,000 Installs |
| Past one million installs | 2.2% (67,563) | 3,037,501 listings | 2.2% of Google Play Listings Show 1M+ Installs |
| 2018 launch class still under 1,000 installs | 30.9% | dated 2018 releases | Three in 10 Surviving 2018 Apps Remain Below 1,000 Installs |
| Updated within the last 6 months | 53.5% | 3,036,563 with an update date | 28% of Google Play Listings Haven’t Been Updated in a Year |
| No update in over a year | 28.3% | 3,036,563 with an update date | 28% of Google Play Listings Haven’t Been Updated in a Year |
| No update in over three years | 8.1% | 3,036,563 with an update date | 28% of Google Play Listings Haven’t Been Updated in a Year |
| Publisher accounts | 1,034,014 | 3,037,501 listings | 3.3% of Google Play Publishers Control 42.8% of Listings |
| Accounts with 10 or more apps | 3.3%, holding 42.8% of listings | 1,034,014 accounts | 3.3% of Google Play Publishers Control 42.8% of Listings |
| Largest single account | 10,985 apps | 1,034,014 accounts | 3.3% of Google Play Publishers Control 42.8% of Listings |
| Typical screenshots per listing | 7 | 3,037,501 listings | Million-Install Apps Use 12 Screenshots, Typical Apps 7 |
| Typical description length | 774 of 4,000 characters | 3,037,501 listings | What Million-Install Google Play Listings Have in Common |
| Have a promo video | 6.3% | 3,037,501 listings | Promo Video Use on Google Play: Prevalence by Install Band |
| Typical permissions requested | 10 | 3,037,501 listings | The Typical Google Play App Declares 10 Permissions |
| Rated Everyone | 90.6% | 3,037,501 listings | What Google Play’s 12-Tester Rule Means for New Developers |
How this page is updated
Last updated 16 September 2026. Testers Community has maintained the database since 2024 and updates new listing activity every week. The current store-wide figures use records observed between 27 July and 25 August 2026. The newest week always appears on the weekly page. When a number here is revised, the date above changes with it, so a citation with the date attached stays correct.
About this data
Every figure on this page comes from the Google Play listing database Testers Community has built and maintained since 2024. This 2026 study analyzes 3,037,501 listings observed from 27 July to 25 August 2026. Every store-wide figure on this page is computed over all of them unless a smaller base is stated in the table. Install counts, prices, ratings, release dates and update dates are the ones shown on each listing. What counts as an app, what is excluded and how percentages are based is set out in how we count Google Play apps.
How to read these findings
- Not a census. These are the listings we could reach. Google publishes no total, so every figure is a share of the 3M+ listings in our data, never a share of the whole Play Store.
- One window. The store-wide figures describe the store as it stood in late summer 2026. Apps delisted before then are missing, which flatters the older launch years.
- Correlation only. Fuller listings sit with higher installs, and games carry more ads. Which causes which is not established here.
- No ranking or search data. Google Play exposes neither, so nothing here says what ranks, only what exists.
- No revenue. Prices, ads and in-app purchase flags are declarations on the listing, not earnings.
Frequently asked questions
How many apps are on Google Play in 2026?
Our current study analyzed 3,037,501 distinct Google Play listings observed between 27 July and 25 August 2026. That is a dated corpus, not a simultaneous store total. Google does not publish an official total.
How many new apps are added to Google Play every day?
About 2,100 a day in 2026, based on 499,548 listings with a 2026 release date through 25 August. A separate discovery batch found 250,952 IDs previously unseen by our database; that is not a weekly launch count.
What share of Google Play apps are free?
97.4% of the 3M+ listings in our data are free to install. 2.56% charge an upfront price, typically $1.99. Among all listings, 27.3% declare ads and 11.4% offer in-app purchases.
How many Google Play apps have a rating?
12.2% show a star rating. Google Play displays a score only once an app has gathered enough ratings, and 878 of every 1,000 listings have not. Among apps first released in 2026, 96.4% show no rating. Where a score is shown, the average is 4.04.
How many installs does a typical Google Play app get?
Between 100 and 499 lifetime installs. 36.4% of listings have never passed 100 installs, 62.7% have never passed 1,000, and 2.2% have passed one million. Averages are pulled up by a few thousand giant apps, so the typical app is the honest figure.
How many Google Play apps are games?
312,795 listings sit in a game category, 10.3% of the 3M+ listings in our data. Games make up 21.1% of the records collected in one discovery batch, a different population from the full study corpus.
How often are these Google Play statistics updated?
Testers Community has maintained its Google Play listing database since 2024 and updates new listing activity every week. The current store-wide study uses 3M+ listings observed between 27 July and 25 August 2026. This page was most recently updated on 16 September 2026.
Citing this research
The Google Play listing database behind this paper has been built and maintained by Testers Community since 2024. Testers Community, Inside Google Play in 2026: What 3M+ Listings Reveal, September 2026. Based on 3,037,501 Google Play listings in the current study, observed from 27 July to 25 August 2026. When you quote a figure, keep the base and the date range with it, and use "at least" with the count, because a store this fluid has no single true total.
Copy a reference
- Plain
- Testers Community (2026). Inside Google Play in 2026: What 3M+ Listings Reveal. https://www.testerscommunity.com/research/google-play-statistics
- APA 7
- Testers Community. (2026, September 16). Inside Google Play in 2026: What 3M+ Listings Reveal. https://www.testerscommunity.com/research/google-play-statistics
- MLA 9
- “Inside Google Play in 2026: What 3M+ Listings Reveal.” Testers Community, 16 Sept. 2026, www.testerscommunity.com/research/google-play-statistics.
- In an article
- according to Testers Community’s analysis of 3,037,501 Google Play listings (September 2026)
- HTML link
<a href="https://www.testerscommunity.com/research/google-play-statistics">Testers Community, Inside Google Play in 2026: What 3M+ Listings Reveal (2026)</a>
Reuse the figures and the table. Everything on this page is free to republish under CC BY 4.0. Keep the source line that is drawn on each figure, and link this page as the source. Each element has its own address so you can point at exactly what you quote: figure 1, figure 2, figure 3 and the data table.
Need a different cut of the data, a comment for an article, or a figure sized for your page? Write to support@testerscommunity.com and say which page you are citing.
Sources
- Metadata, Google Play Console Help
- View and analyze your app's ratings and reviews, Google Play Console Help
- Paid apps, in-app products & subscriptions, Google Play Console Help