
Search for average app installs and the answers come back in millions, computed over stores where almost nothing is famous. We measured 3M+ listings, and the honest middle is a different world: the typical app has between 100 and 499 lifetime installs. This page maps the whole distribution, band by band, so you can benchmark your app against the store as it actually is rather than against the outliers.
The short answer
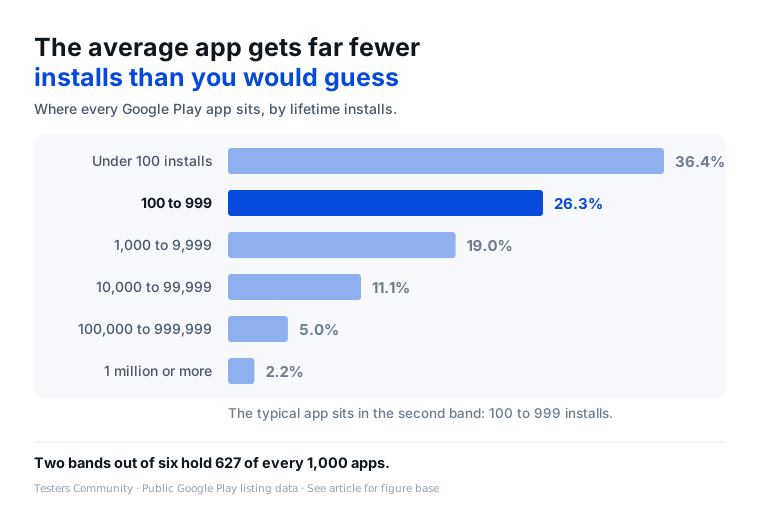
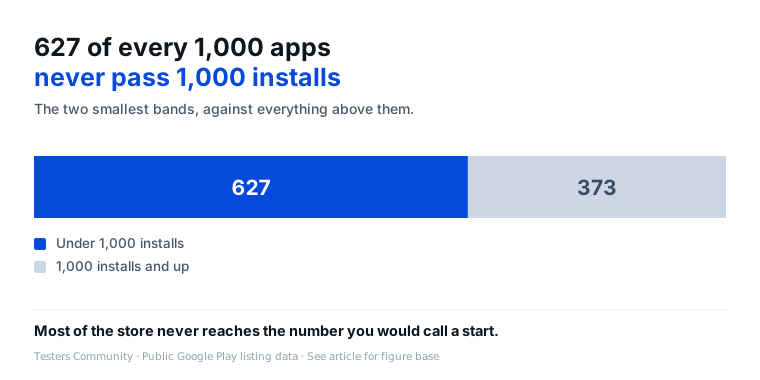
The average app on Google Play has between 100 and 499 lifetime installs, if by average you mean the median, and here you should. A mean is useless on this data, because a small group of giants holds most of the installs and drags it far above anything typical. In our data 627 of every 1,000 apps never pass 1,000 installs, and only 22 in 1,000 ever pass a million. If your app has a few hundred installs, you are not behind the average. You are the average.
What is the honest average?
The word average hides a choice between two numbers, and on install data the choice decides everything. The median is the middle app when all of them are lined up by installs, and in our data it sits in the 100 to 499 band. The mean is the total of all installs divided by the number of apps, and here it is a broken instrument.
It breaks because installs are concentrated at the top. Only 22 of every 1,000 apps have ever passed a million installs, yet that thin summit holds the bulk of everything the store has ever installed. Spread their totals across all apps and the mean lands on a figure that describes no app anyone actually shipped. That is why every number on this page is a median or a share, never a mean.
How are installs distributed?
The store is bottom heavy. The single largest band is the one under 100 installs, holding 364 of every 1,000 listings in our data. Add the next band and 627 of 1,000 sit below 1,000 lifetime installs. The bands keep shrinking all the way up.
The full picture, with one column most benchmark posts leave out: whether apps in each band even show a star rating. Google Play displays a score only after enough ratings arrive, so the rating column doubles as a reach test.
| Lifetime installs | Of every 1,000 apps | Share of the 3,037,501 listings | Show a star rating |
|---|---|---|---|
| Under 100 | 364 | 36.4% | 0.1% |
| 100 to 999 median app here | 263 | 26.3% | 2.4% |
| 1,000 to 9,999 | 190 | 19.0% | 12.7% |
| 10,000 to 99,999 | 111 | 11.1% | 32.9% |
| 100,000 to 999,999 | 50 | 5.0% | 68.0% |
| 1,000,000 and up | 22 | 2.2% | 93.6% |
Read the median band's row again. The typical app not only has a few hundred installs, it shows no rating either: just 2.4% of apps in that band display a score. Across the whole data, 878 of every 1,000 listings are unrated. A quiet, starless listing is not a failing app. It is the most common kind of app there is.
What counts as doing well?
With the spread in hand, milestones stop being vibes and become percentiles. Pass 100 installs and you have cleared the largest band on the store, the 364 in 1,000 that never get there. Pass 1,000 and you are ahead of 627 of every 1,000 apps.
From there, each extra digit thins the field fast. Only 183 of every 1,000 apps have reached 10,000 installs, so a five-figure count already puts you in roughly the top fifth. Reaching 100,000 narrows the company to 72 per 1,000, and the million-install club admits 22. A number that sounds small next to the apps you read about can still be a top-quintile result on the shelf you actually compete on.
Why is the middle so low?
Because the conditions of the store keep it low, not because most developers built something broken. About 2,100 new apps arrive every day. New listings launch silent, with 96.4% of 2026 releases showing no rating, so they convert visitors poorly and stay small. And a large slice of the shelf is abandoned, with 283 of every 1,000 listings silent for over a year.
We measured those forces in detail, launch class by launch class, in our study of why apps get so few installs. The short version for benchmarking purposes: low installs are the store's default outcome, the spread is set early in an app's life. And the parts you control are the listing and the launch preparation.
How should you benchmark?
Use the band ladder, not the legends. If you are under 100 installs, the working target is the next band, where 263 of every 1,000 apps sit alongside the median. If you are in the median band, the target is four figures, which fewer than half the store ever reaches. Comparing a two-month-old app to a chart-topper is not a benchmark, it is a mood.
And the cheapest installs to plan for are the ones before launch. If you publish from a new personal account, Google already requires a closed test with 12 opted-in testers for 14 continuous days before you can apply for production access. Run it as the rehearsal it is: real users, real usage, first feedback while changes cost nothing, so your public counter does not start from a standstill.
About this data
Every figure on this page comes from the Google Play listing database Testers Community has built and maintained since 2024. This 2026 study analyzes 3,037,501 listings observed from 27 July to 25 August 2026. Every figure above is computed over all of them. Install counts are the ones shown on the listing, and bands are lifetime totals, not monthly figures. What counts as an app, what is excluded and how percentages are based is set out in how we count Google Play apps.
How to read these findings
- Study population. Every figure is a share of the 3M+ listings in our data, never a share of the whole Play Store, whose total Google does not publish.
- Lifetime, not current. Install bands count every install an app has ever had. An app at 50,000 lifetime installs may have almost no active users today, and this data cannot separate the two.
- Current study snapshot. Our database has been maintained since 2024. The distribution is a photograph of one month in 2026, not a film. Delisted apps are missing, which makes the surviving population look slightly better than the full history of launches would.
- Google Play only. Nothing here describes the Apple App Store, and iOS install spreads may differ.
- Revenue scope. Listing install counts do not measure earnings.
Frequently asked questions
How many installs does the average app get?
The median app in our 3M+ Google Play listing study has between 100 and 499 lifetime installs. The median is the honest average here, because a small group of giant apps holds most of the installs and drags any mean far above what a typical app ever sees. 627 of every 1,000 apps never pass 1,000 installs.
Why use the median instead of the mean for installs?
Because install counts are extremely skewed: 22 of every 1,000 apps have passed a million installs, and that small group holds the bulk of all installs on the store. A mean divides their totals across everyone and lands on a number that describes no real app. The median, the middle app when all are lined up by installs, sits at 100 to 499.
What is a good number of installs for a new app?
Passing 1,000 lifetime installs already puts you ahead of 627 of every 1,000 apps in our data. Passing 100 clears the largest single band, the 364 in 1,000 that never get there. Benchmark against these shares rather than against famous apps, which sit in a band of 22 per 1,000.
How many apps never pass 1,000 installs?
627 of every 1,000 apps in our 3M+ listing study have never passed 1,000 lifetime installs. That splits into 364 per 1,000 still under 100 installs and 263 per 1,000 in the 100 to 999 band, which is also where the typical app sits.
Is 10,000 installs a lot for an app?
Yes, by the store's own distribution: only 183 of every 1,000 apps in our data have reached 10,000 lifetime installs. So a five-figure count places you in roughly the top fifth. Reaching 100,000 narrows that to 72 per 1,000, and a million to 22 per 1,000.
What share of apps reach 1 million installs?
22 of every 1,000 apps in our data have passed one million lifetime installs, about 1 in 45. The whole band from 100,000 up holds just 72 per 1,000, while half the store sits below 500 installs.
Do most Google Play apps have ratings?
No. 878 of every 1,000 apps in our data show no star rating at all, because Google Play only displays a score after enough ratings arrive. In the median install band, 100 to 999, just 2.4% of apps show one, rising to 93.6% past a million installs. A silent listing is the normal state of a normal app.
How can I get my first installs before launch?
Use the closed test Google already requires: new personal accounts must run 12 opted-in testers for 14 continuous days before applying for production access. That is a built-in rehearsal, two weeks of real users in the app before strangers judge the listing. And we supply the 12 testers within 6 hours if you do not have them.
Citing this research
The Google Play listing database behind this paper has been built and maintained by Testers Community since 2024. Testers Community, Most Google Play Apps Never Reach 1,000 Installs, August 2026. Based on 3,037,501 listings in the current study, observed from 27 July to 25 August 2026. When you quote a figure, keep the base and the date range with it, because both change what the number means.
Copy a reference
- Plain
- Testers Community (2026). Most Google Play Apps Never Reach 1,000 Installs. https://www.testerscommunity.com/research/average-app-installs
- APA 7
- Testers Community. (2026, October 7). Most Google Play Apps Never Reach 1,000 Installs. https://www.testerscommunity.com/research/average-app-installs
- MLA 9
- “Most Google Play Apps Never Reach 1,000 Installs.” Testers Community, 7 Oct. 2026, www.testerscommunity.com/research/average-app-installs.
- In an article
- according to Testers Community’s analysis of 3,037,501 Google Play listings (August 2026)
- HTML link
<a href="https://www.testerscommunity.com/research/average-app-installs">Testers Community, Most Google Play Apps Never Reach 1,000 Installs</a>
Reuse the figures and the table. Everything on this page is free to republish under CC BY 4.0. Keep the source line that is drawn on each figure, and link this page as the source. Each element has its own address so you can point at exactly what you quote: figure 1, figure 2 and the data table.
Need a different cut of the data, a comment for an article, or a figure sized for your page? Write to support@testerscommunity.com and say which page you are citing.
Sources
- App testing requirements for new personal developer accounts, Google Play Console Help
- View and analyze your app's ratings and reviews, Google Play Console Help