
You built the app, you shipped it, and the install counter is barely moving. Before you blame your idea, look at the base rate: we measured 3M+ listings, and the typical app has between 100 and 499 lifetime installs. Low installs are not the exception on Google Play. Here are five measured patterns that put that baseline in context, including the listing elements a developer can change.
The short answer
627 of every 1,000 listings in our study remain below 1,000 lifetime installs. New releases enter a crowded market, most show no rating, and many established listings remain at low install levels. Listing depth and update activity vary by install band. These are observed conditions, not a diagnosis of any one app's performance.
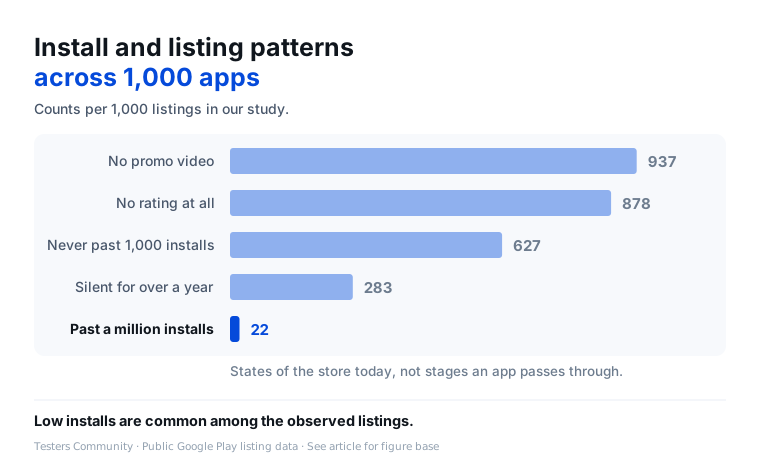
How few installs is normal?
Skewed numbers hide this, so start with the honest baseline. 364 of every 1,000 apps never pass 100 lifetime installs. 627 never pass 1,000. The typical app sits between 100 and 499. Only 22 in 1,000 have ever crossed a million.
So if your app is at 60 installs after a month, you are not failing against the field. You are the field. The question worth asking is not "what is wrong with my app" but "what separates the 22". That is what the rest of this study measures.
Observed condition 1: 2,100 new apps a day
499,548 of the apps in our data were first released in 2026, and our data stops at 25 August. That is roughly 2,100 new apps every day, and the pace is accelerating: 2026 passed the whole of 2025 (399,738) with four months to spare.
Crowding alone does not doom an app. But every one of those launches competes for the same finite attention, and most arrive in the same handful of categories. Education alone holds 337,128 listings. Whatever you shipped, several hundred functional cousins shipped the same quarter.
Observed condition 2: the cold start loop
Google Play shows a star rating only after an app has gathered enough ratings. In our data, 0.1% of apps under 100 installs show a rating, and the share climbs with reach to 93.6% past one million. For apps launched in 2026, 964 of 1,000 show nothing.
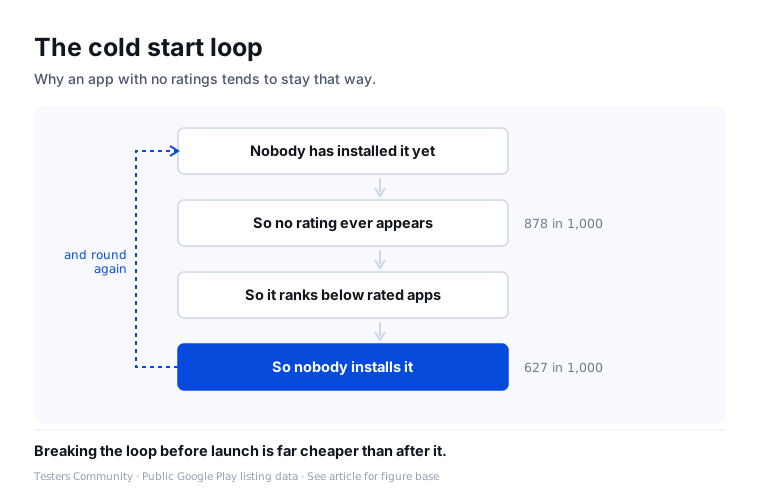
This is the loop that quietly eats new apps. A visitor lands on a page with no stars, no reviews and a thin description, and installs something with social proof instead. Fewer installs mean the stars take longer to appear, which means fewer installs. Nothing in the loop is broken. It is a stable state, and it only breaks from outside: users you bring yourself, reviews you earn before the public arrives, a page good enough to convert cold traffic.
Observed condition 3: a half empty listing
The one part of this problem a developer fully controls is the store page, and the store mostly does not use it. The typical listing spends 774 of the 4,000 description characters Google Play allows and 16 of the 30 title characters. Only 63 in 1,000 listings carry a promo video.
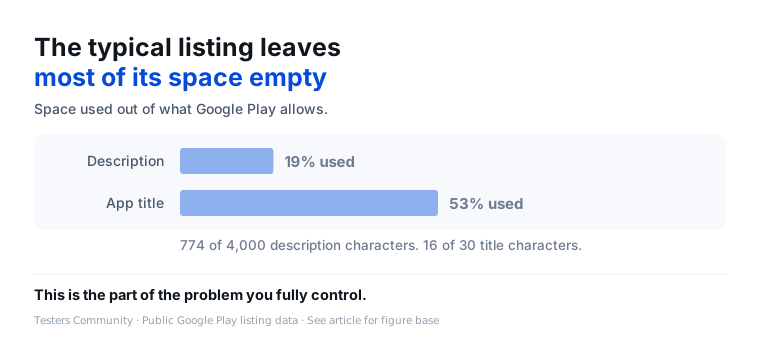
Now set that against the apps that made it. Past one million installs, the typical listing carries 12 screenshots against 6, a 1,807 character description against 687, and a video 28% of the time against 3.5%. This is an association, not evidence that fuller pages caused the installs; successful apps can also invest more in their listings. But the gap sits in things you can change this week, which is more than can be said for the other four reasons.
Observed condition 4: older apps stay small
Among surviving listings released in 2023, 591 in 1,000 remain under 1,000 lifetime installs. The share is 455 in 1,000 among surviving listings released in 2021. These are present-day comparisons between different groups of apps.
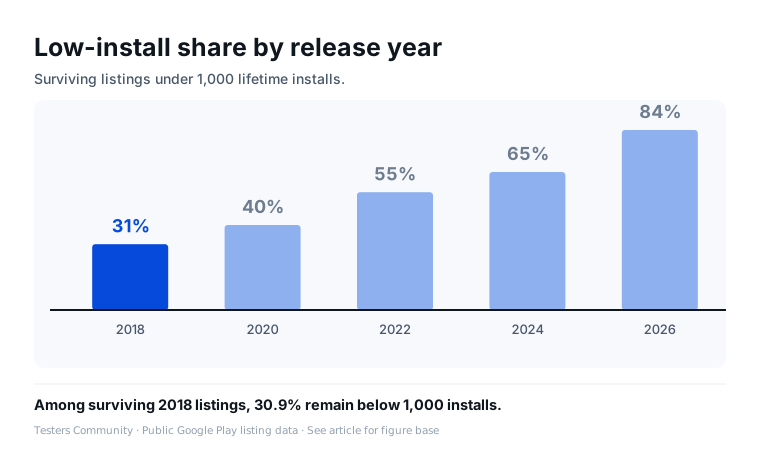
These cohorts include only listings still observed in our study. They provide a benchmark for surviving apps of different ages, not a record of how any one app's installs changed. For a growth decision, compare your app's own install history before and after a change.
Observed condition 5: the dead and the bulk
The study's 3M+ listings are not a count of direct rivals. 283 of every 1,000 observed listings have not shipped an update in over a year, and 81 have gone more than three years. Accounts with ten or more observed apps hold 428 of every 1,000 listings.
These figures describe update recency and publisher concentration. They do not measure which listings appear beside your app in search or compete for the same users.
What actually moves the number
Three of the five reasons, the flood, the launch class gravity and the cluttered shelf, are the weather. You do not control them, you plan around them. The two you do control both have to be handled before launch, because the cold start loop starts the moment your page goes public.
Build the page to the benchmark of the band above you. Not to the store average, which is a half empty page. Twelve screenshots, a description that uses its space, a video if you can make one. It costs a weekend and it is the cheapest variable in this entire study.
Do not launch to strangers first. The apps that escape the loop arrive with usage, feedback and first reviews already in motion. If you are on a new personal account, Google has already scheduled this for you: 12 opted-in testers for 14 continuous days before you can apply for production access. Treat that as the rehearsal it is. Real people in the app, bugs found while fixing is cheap, and momentum on day one instead of silence.
About this data
Every figure on this page comes from the Google Play listing database Testers Community has built and maintained since 2024. This 2026 study analyzes 3,037,501 listings observed from 27 July to 25 August 2026. Every figure above is computed over all of them. Install counts are the ones shown on the listing. What counts as an app, what is excluded and how percentages are based is set out in how we count Google Play apps.
How to read these findings
- Study population. Every figure is a share of the 3M+ listings in our data, never a share of the whole Play Store, whose total Google does not publish.
- Current study snapshot. Our database has been maintained since 2024. Cohort strips compare apps of different ages today; they do not track one set of apps through time. Delisted apps are missing, which makes the old launch classes look better than their full launch classes did.
- Correlation only. Fuller listings sit with higher installs. Which causes which is not established here.
- No ranking or search data. Google Play exposes neither, so this study cannot say what ranks, only what exists.
- Revenue scope. Listing install counts do not measure earnings.
Frequently asked questions
Why is my app not getting installs on Google Play?
Because almost no app does at first: the typical app in our 3M+ listing study sits at 100 to 499 lifetime installs. Five measurable conditions work against a new app: about 2,100 new apps launch every day, 964 of every 1,000 apps released in 2026 show no rating, the typical listing uses a fifth of its description space, three-year-old apps are mostly still under 1,000 installs, and 283 of every 1,000 listings on the shelf are abandoned. The listing and the launch preparation are the parts you control.
How many installs does the average Google Play app get?
The typical app in our data has between 100 and 499 lifetime installs. 364 of every 1,000 apps never pass 100 installs and 627 never pass 1,000. Averages mislead here because a small number of giant apps pull them up, so the typical is the honest number.
How many new apps are added to Google Play every day?
About 2,100 a day in 2026, based on our data: 499,548 of the apps in our data were first released in 2026, and our data runs to 25 August. That pace is ahead of all of 2025, which produced 399,738.
What do older release-year cohorts show?
Among surviving listings released in 2023, 591 in 1,000 remain below 1,000 lifetime installs; the share is 455 in 1,000 for surviving 2021 listings. These cohort comparisons do not track individual apps through time.
Does a better store listing get more installs?
This study shows a listing benchmark, not a measured causal effect. Apps past one million installs have a median of 12 screenshots versus 6 for apps under 100 installs, a median description length of 1,807 versus 687 characters, and a promo video on 28% versus 3.5% of listings. Successful apps may also invest more in their pages.
Why does my app have no ratings yet?
Because ratings need reach before they appear at all: Google Play only shows a score once an app has gathered enough ratings. In our data 0.1% of apps under 100 installs show a rating, rising to 93.6% past one million. Among apps launched in 2026, 964 of 1,000 show no rating. A silent listing is the normal state of a new app, not a fault in yours.
How many apps pass one million installs?
22 of every 1,000 apps in our data have passed one million lifetime installs, roughly 1 app in 45. Half the store sits below 500 installs.
What can I do before launch to avoid a silent release?
Do the things the bigger bands already did: fill the listing to their benchmark, put real users in the app before release. And treat Google's mandatory closed test as a rehearsal rather than a delay. New personal accounts must run 12 opted-in testers for 14 continuous days before production access, which is two weeks of real usage while changes are still cheap.
Citing this research
The Google Play listing database behind this paper has been built and maintained by Testers Community since 2024. Testers Community, Why Most Google Play Apps Remain Below 1,000 Installs, August 2026. Based on 3,037,501 listings in the current study, observed from 27 July to 25 August 2026. When you quote a figure, keep the base and the date range with it, because both change what the number means.
Copy a reference
- Plain
- Testers Community (2026). Why Most Google Play Apps Remain Below 1,000 Installs. https://www.testerscommunity.com/research/why-play-store-apps-get-low-installs
- APA 7
- Testers Community. (2026, September 16). Why Most Google Play Apps Remain Below 1,000 Installs. https://www.testerscommunity.com/research/why-play-store-apps-get-low-installs
- MLA 9
- “Why Most Google Play Apps Remain Below 1,000 Installs.” Testers Community, 16 Sept. 2026, www.testerscommunity.com/research/why-play-store-apps-get-low-installs.
- In an article
- according to Testers Community’s analysis of 3,037,501 Google Play listings (August 2026)
- HTML link
<a href="https://www.testerscommunity.com/research/why-play-store-apps-get-low-installs">Testers Community, Why Most Google Play Apps Remain Below 1,000 Installs</a>
Reuse the figures and the table. Everything on this page is free to republish under CC BY 4.0. Keep the source line that is drawn on each figure, and link this page as the source. Each element has its own address so you can point at exactly what you quote: figure 1, figure 2, figure 3 and figure 4.
Need a different cut of the data, a comment for an article, or a figure sized for your page? Write to support@testerscommunity.com and say which page you are citing.
Sources
- App testing requirements for new personal developer accounts, Google Play Console Help
- View and analyze your app's ratings and reviews, Google Play Console Help
- Add preview assets to showcase your app, Google Play Console Help